Apologies in advanced for the music tastes.
I recently learned Spotify provides downloads for users’ streaming history. For me, this is over 10 years worth of data, so at the very least it seemed like a good nostalgia trip. This post covers some of my analysis of my personal export, and hopefully is a good starting place if you’re interested in exploring your own.
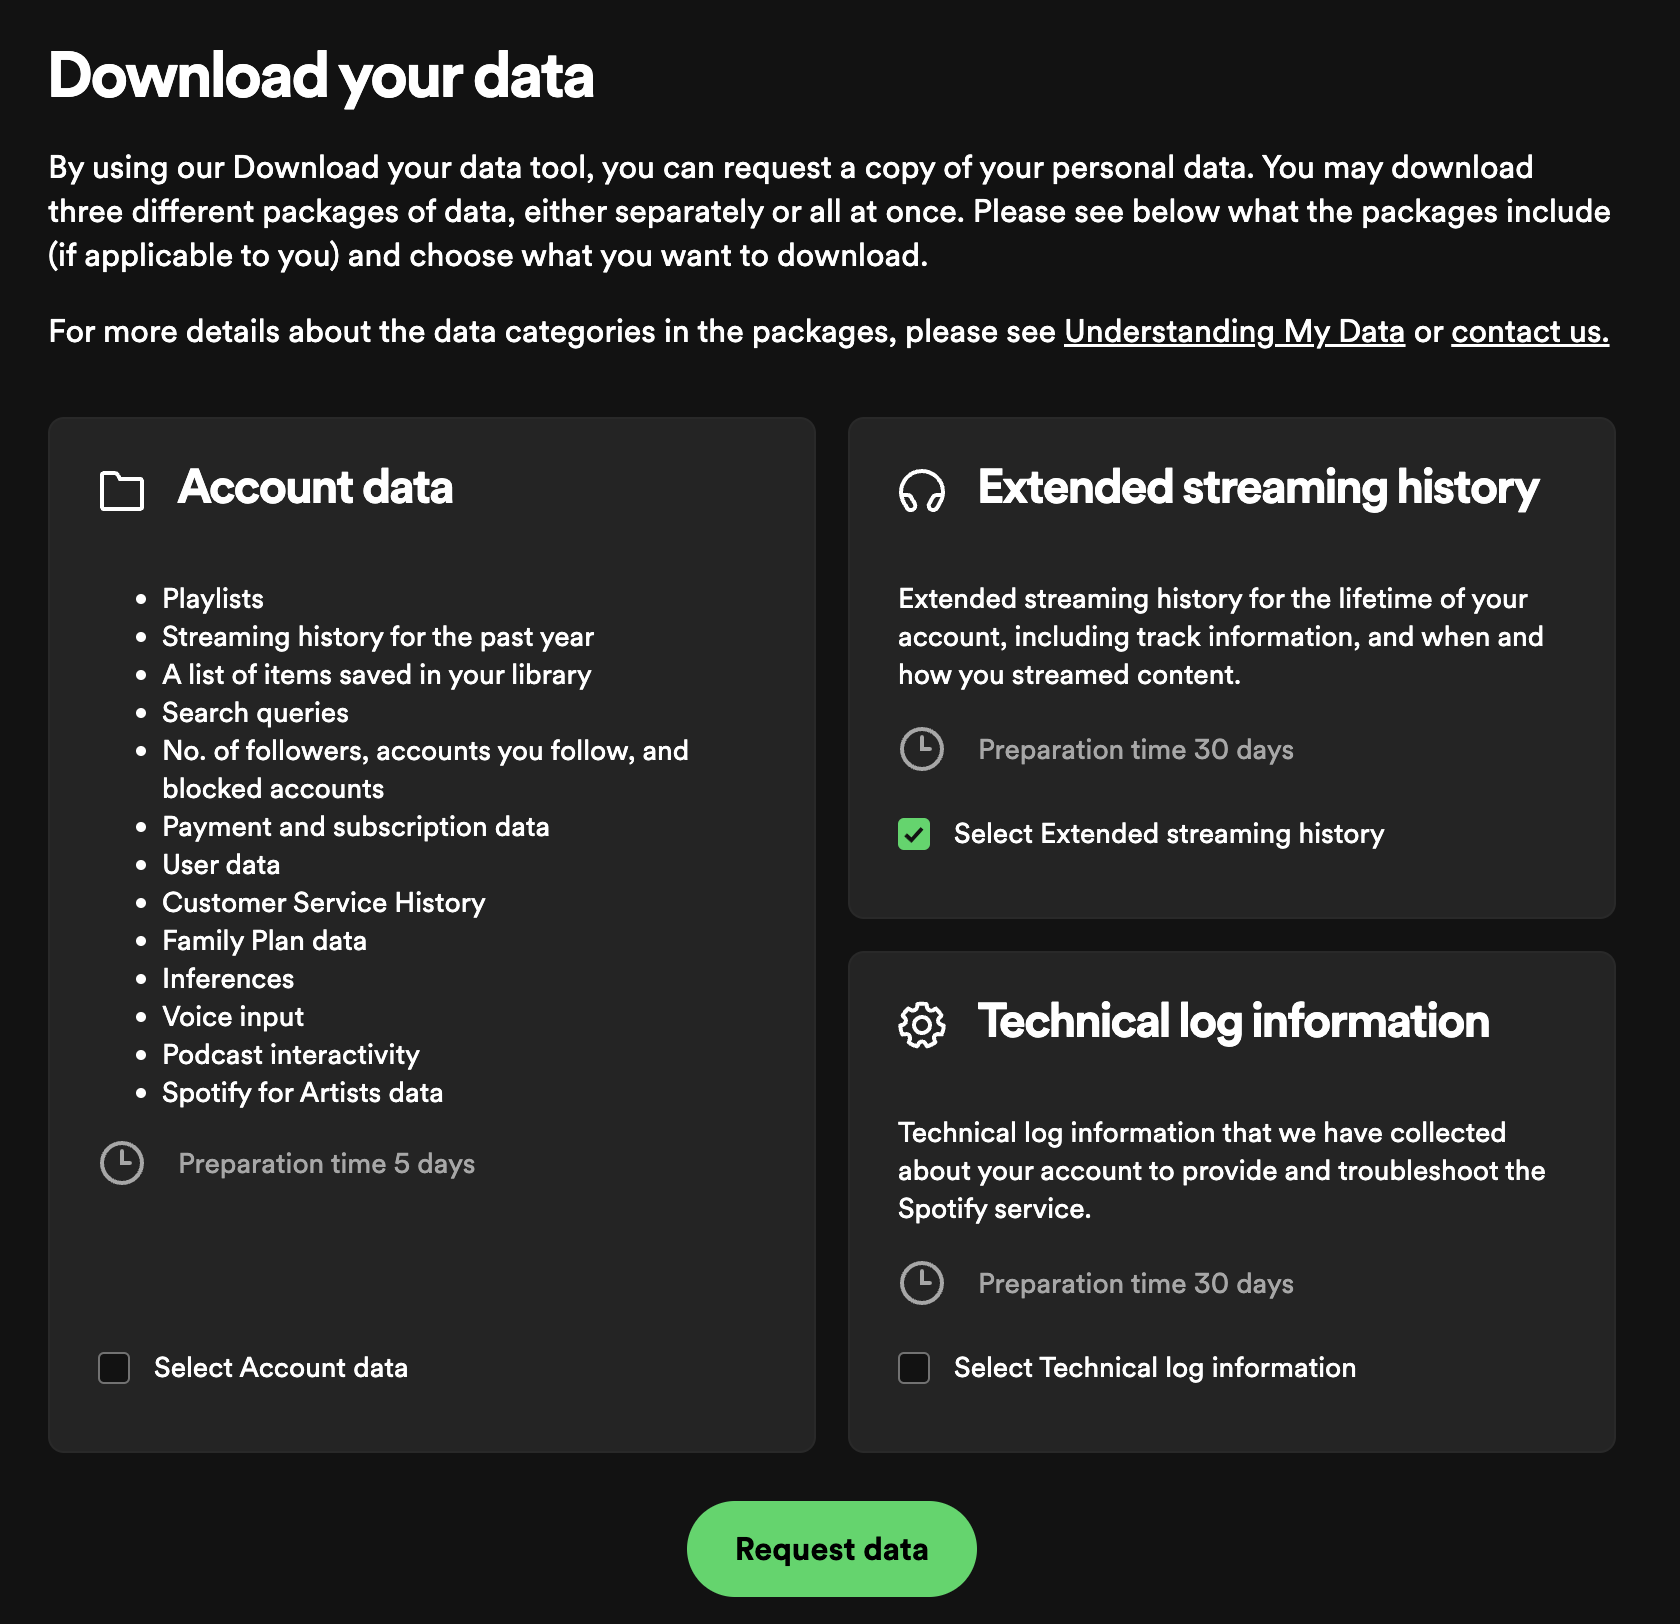
To request your data, visit your Spotify account’s privacy page and select “Extended streaming history.”
https://www.spotify.com/us/account/privacy/ (must be logged in)
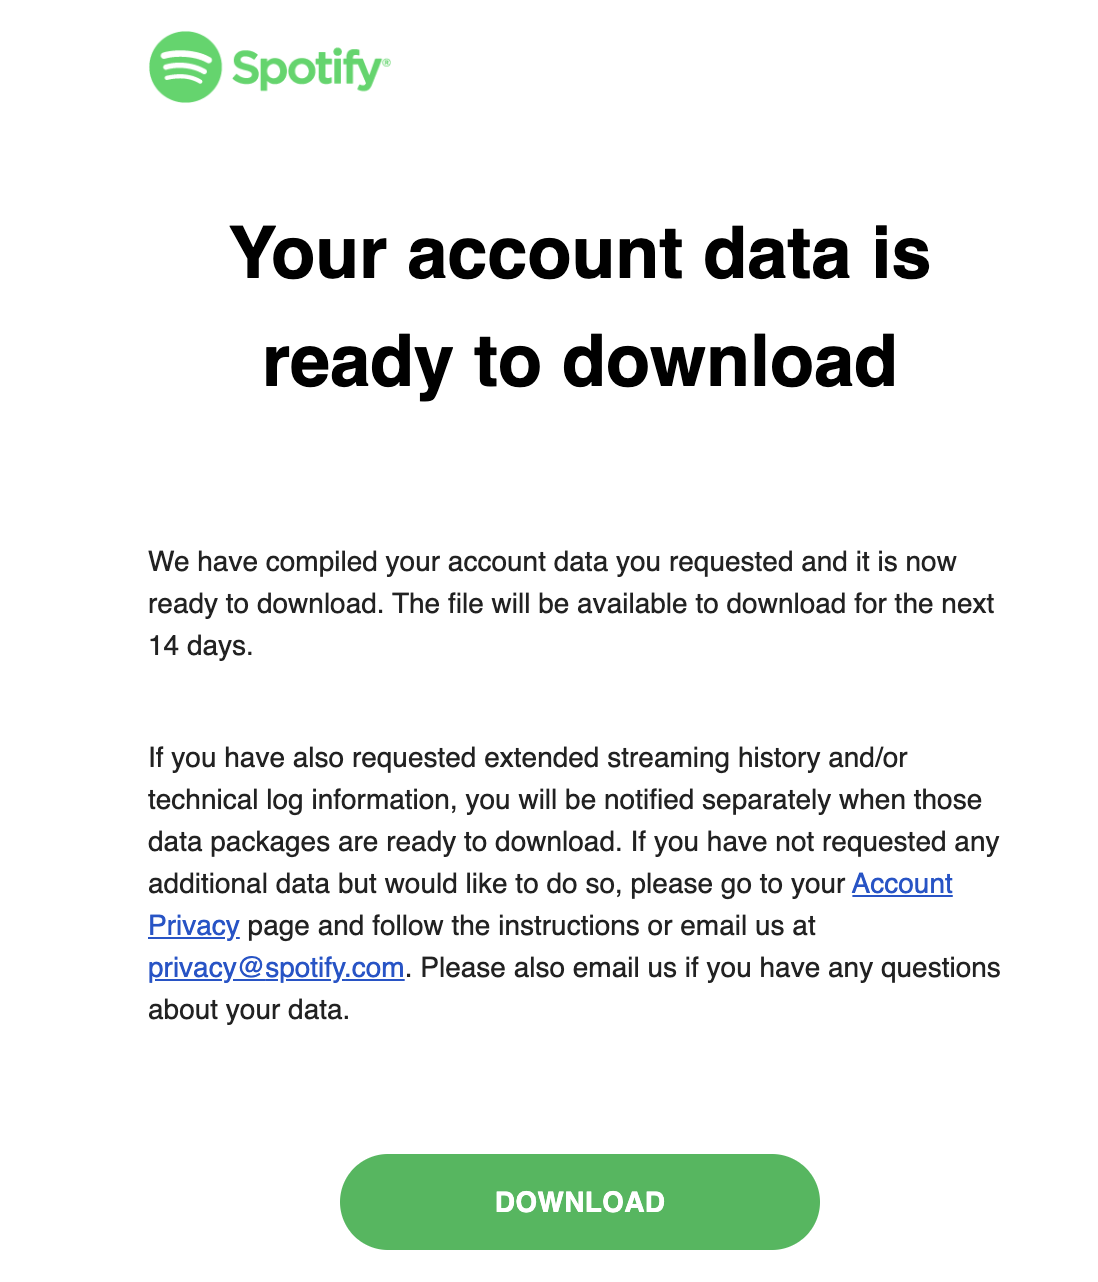
Four days after I requested, this arrived in my inbox:
Streaming events
The linked data is one big zip file comprising of many JSON formatted events. There’s also “ReadMeFirst” PDF with file format overviews in an impressive number of languages (“Merci pour votre patience pendant que nous collections vos données.”), but I found the JSON object keys to be sufficiently self-descriptive.
% zipinfo my_spotify_data.zip
Archive:  my_spotify_data.zip
Zip file size: 6518359 bytes, number of entries: 11
-rw----     2.0 fat 10503054 bl defN 23-Oct-30 20:13 MyData/Streaming_History_Audio_2013-2015_0.json
-rw----     2.0 fat 10500507 bl defN 23-Oct-30 20:13 MyData/Streaming_History_Audio_2015-2016_1.json
-rw----     2.0 fat 10503403 bl defN 23-Oct-30 20:13 MyData/Streaming_History_Audio_2016-2017_2.json
-rw----     2.0 fat 10502316 bl defN 23-Oct-30 20:13 MyData/Streaming_History_Audio_2017-2018_3.json
-rw----     2.0 fat 10502813 bl defN 23-Oct-30 20:13 MyData/Streaming_History_Audio_2018-2019_4.json
-rw----     2.0 fat 10502255 bl defN 23-Oct-30 20:13 MyData/Streaming_History_Audio_2019-2020_5.json
-rw----     2.0 fat 10504112 bl defN 23-Oct-30 20:13 MyData/Streaming_History_Audio_2020-2022_6.json
-rw----     2.0 fat  5299981 bl defN 23-Oct-30 20:13 MyData/Streaming_History_Audio_2022-2023_7.json
-rw----     2.0 fat    63383 bl defN 23-Oct-30 20:13 MyData/Streaming_History_Video_2018-2023.json
-rw----     2.0 fat       11 bl defN 23-Oct-30 20:13 MyData/
-rw----     2.0 fat  1498030 bl defN 23-Oct-30 20:13 MyData/ReadMeFirst_ExtendedStreamingHistory.pdf
11 files, 80379865 bytes uncompressed, 6516375 bytes compressed:  91.9%
I used Jupyter, Pandas, and Matplotlib for this analysis. First, let’s read in the data and see what we’re working with.
import datetime
import zipfile

import pandas as pd

dfs = []
zf = zipfile.ZipFile('my_spotify_data.zip', 'r')
for name in zf.namelist():
    if 'Streaming_History_Audio_' not in name:
        continue
    dfs.append(pd.read_json(zf.open(name)))

df = pd.concat(dfs)

print("Columns:", df.columns.values)
print("Number of streams:", str(df.shape[0]))
print(datetime.timedelta(milliseconds=int(df['ms_played'].sum())))
My data contained over 120,000 events and 217 days worth of streaming time. The individual records contain a lot of what you’d expect. The track name, artist, album, and how much time the song was played for. There’s also some odd ones like what IP address I used to connect to Spotify, but maybe we’ll look at that another day.
Columns: ['ts' 'username' 'platform' 'ms_played' 'conn_country' 'ip_addr_decrypted'
 'user_agent_decrypted' 'master_metadata_track_name'
 'master_metadata_album_artist_name' 'master_metadata_album_album_name'
 'spotify_track_uri' 'episode_name' 'episode_show_name'
 'spotify_episode_uri' 'reason_start' 'reason_end' 'shuffle' 'skipped'
 'offline' 'offline_timestamp' 'incognito_mode']
Number of streams: 120673
217 days, 9:07:07.465000
Analysis
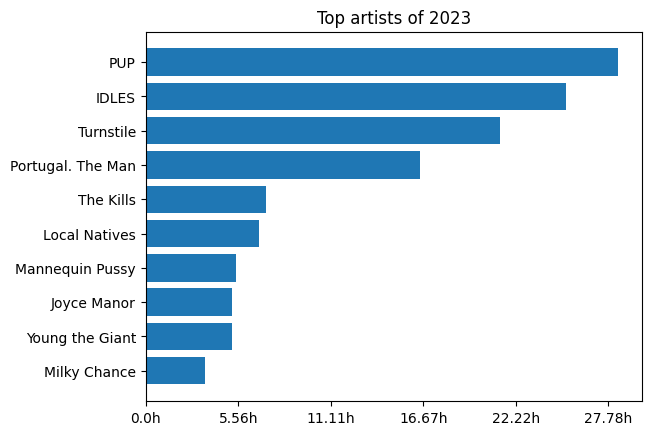
If you haven’t used it before, Pandas is the gold standard for tabular data munging. If there’s a way to slice, transform, parser, or summarize data, you can do it with a Pandas data frame. To start us off, let’s look at my top artists of 2023 by total time listened to.
import matplotlib.pyplot as plt
import matplotlib.dates as mdates

from matplotlib.ticker import FuncFormatter

def format_ms(x, pos):
    return str(round(x/(3.6e+6), 2)) + 'h'

# Filter by year, group by artist, sum time played and take top ten.
year_df = df.loc[pd.to_datetime(df['ts']).apply(lambda t: t.year == 2023)]
year_df = year_df.groupby(['master_metadata_album_artist_name'])[['ms_played']].sum()
year_df = year_df.sort_values('ms_played', ascending=False)
year_df = year_df[:10]

fig, ax = plt.subplots()

plt.gca().xaxis.set_major_formatter(format_ms)
ax.barh(year_df.index.values, year_df['ms_played'])
ax.set_title('Top artists of 2023')
ax.invert_yaxis()
plt.show()
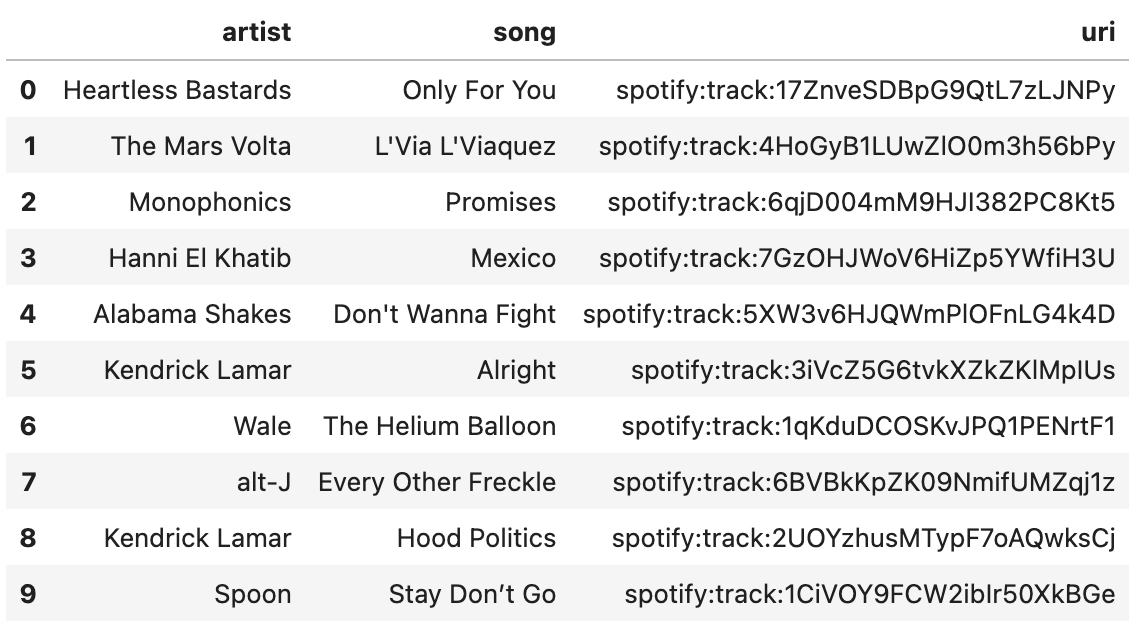
The data Spotify provides is perfected for these Wrapped style “top X” views. By far the most fun I had was looking at the most played songs of a given year. Here’s my top songs for 2015.
df_tracks = df[['master_metadata_album_artist_name', 'master_metadata_track_name', 'ts', 'ms_played', 'spotify_track_uri']]
df_tracks = df_tracks[pd.to_datetime(df_tracks['ts']).apply(lambda t: t.year == 2015)]
df_tracks = df_tracks.groupby(['master_metadata_album_artist_name', 'master_metadata_track_name', 'spotify_track_uri'])
df_tracks = df_tracks.sum('ms_played')
df_tracks = df_tracks.sort_values('ms_played', ascending=False)[:10]
df_tracks = pd.DataFrame(df_tracks.index.values.tolist(), columns=['artist', 'song', 'uri'])
df_tracks
Maybe a logical next step would be generating playlists?
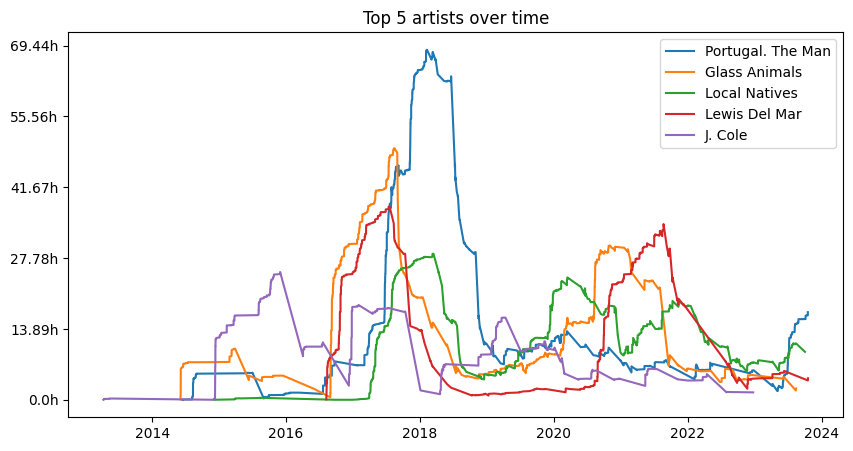
What about ongoing trends rather than just breaking things up year-by-year? Graphing the rolling sum of time played, we can look at information like how much I listened to a given artist over time.
# Determine top artists listened to.
top_artists_df = df.groupby(['master_metadata_album_artist_name'])[['ms_played']]
top_artists_df = top_artists_df.sum().sort_values('ms_played', ascending=False)[:5]
top_artists = [artist for (artist) in top_artists_df.index.values]

fig, ax = plt.subplots(figsize=(10, 5))
for artist in top_artists:
  # Generate rolling sums of total amount of time listening to the artist.
  df2 = df.loc[df['master_metadata_album_artist_name'] == artist][['ts', 'ms_played']]
  df2['ts'] = df2['ts'].apply(pd.to_datetime)
  df2 = df2.sort_values('ts')
  df2 = df2.rolling('365D', on='ts').sum()
  ax.plot(df2['ts'], df2['ms_played'], label=artist)

ax.set_title('Top 5 artists over time')
plt.gca().yaxis.set_major_formatter(format_ms)
plt.legend()
plt.show()
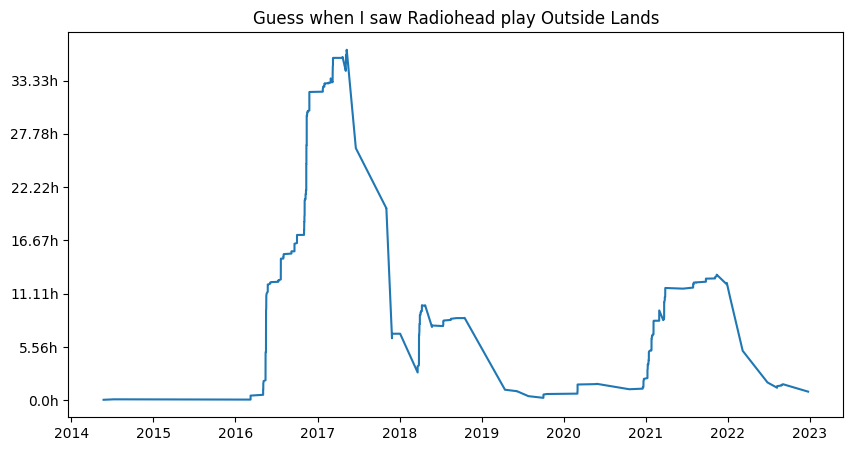
Or to provide a cleaner view, let’s look at a single artist.
fig, ax = plt.subplots(figsize=(10, 5))
artist = 'Radiohead'
df2 = df.loc[df['master_metadata_album_artist_name'] == artist][['ts', 'ms_played']]
df2['ts'] = df2['ts'].apply(pd.to_datetime)
df2 = df2.sort_values('ts')
df2 = df2.rolling('365D', on='ts').sum()
ax.plot(df2['ts'], df2['ms_played'], label=artist)

ax.set_title('Guess when I saw Radiohead play Outside Lands')
plt.gca().yaxis.set_major_formatter(format_ms)
plt.show()
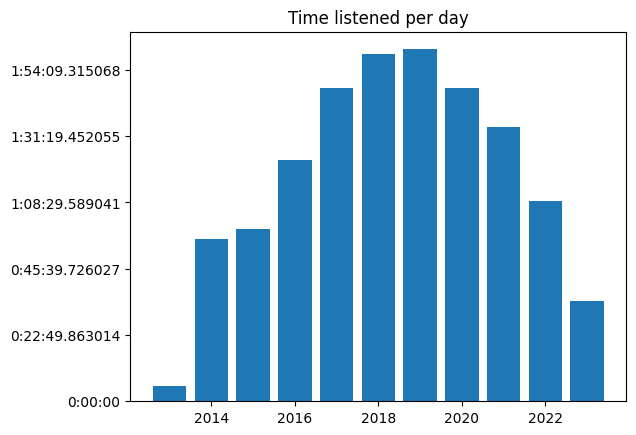
While poking around, I wanted to see what my overall usage of Spotify looked like over the years. Did commuting or the pandemic impact my listening?
df_years = df[['ts', 'ms_played']].copy()
df_years['year'] = pd.to_datetime(df_years['ts']).apply(lambda t: t.year)
df_years = df_years.groupby(['year'])['ms_played'].sum()

def format_ms_timedelta(x, pos):
    return datetime.timedelta(milliseconds=x) / 365

fig, ax = plt.subplots()
ax.set_title('Time listened per day')
ax.bar(df_by_year.index, df_by_year)
ax.yaxis.set_major_formatter(format_ms_timedelta)
plt.show()
Finally, let’s go back to 2014, the first year I have full data from. What albums were speaking to a fresh-out-of-college me?
df_album_by_year = df.loc[pd.to_datetime(df['ts']).apply(lambda t: t.year == 2014)]
df_album_by_year = df_album_by_year.groupby(['master_metadata_album_album_name', 'master_metadata_album_artist_name'])
df_album_by_year = df_album_by_year[['ms_played']].sum().sort_values('ms_played', ascending=False)[:10]
albums = [album + " - " + artist for (album, artist) in df_album_by_year.index.values]

def format_ms_timedelta(x, pos):
    return datetime.timedelta(milliseconds=x)

fig, ax = plt.subplots(figsize=(4, 4))
ax.xaxis.set_major_formatter(format_ms_timedelta)
ax.barh(albums, df_album_by_year['ms_played'])
ax.set_title('Top albums of 2014')
ax.invert_yaxis()
plt.show()
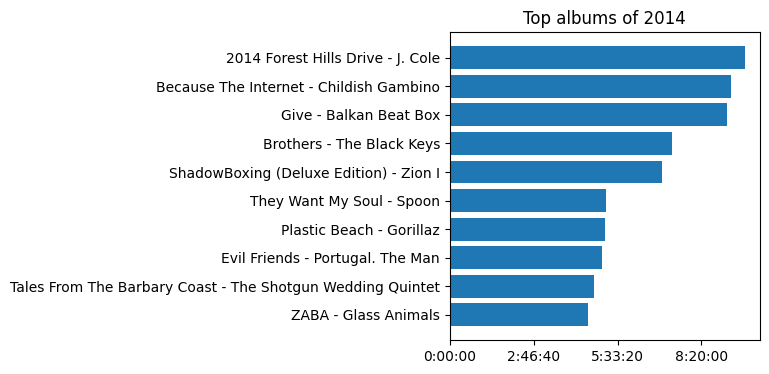
Ah, that brings me back.
Right of access
Compliance is clearly a motivating factor for Spotify to provide this data. But as a happy Spotify user, I’ve enjoyed this feature and am glad they built it. I was able to take a weekend, hack around, and get some great nostalgia because I found it valuable. It didn’t require some product lifecycle and business justification to build into the Spotify app.
Hopefully this post will empower some others to take their own trip down memory lane with this data.